
Download Your Rainfall Charts
Looking Back at 2025 & Setting Up for 2026
No two seasons are ever the same. Rainfall can shift dramatically from month to month and year to year — which is exactly why keeping a simple, consistent record is so valuable.
🌧️ Rainfall Chart Results – 2025
The 2025 rainfall chart shows just how variable the year was, with clear contrasts between wet and dry periods.
2025 at a glance:
-
Total annual rainfall: 726 mm
-
Wettest month: June (151 mm)
-
Driest month: January (15 mm)
-
Overall rainfall was 726 mm
• That’s 106 mm higher than 2024, which recorded 620 mm for the year• That’s only 72 mm below the four-year average
👉 Download Rainfall Chart Results 2025 (RESULTS)
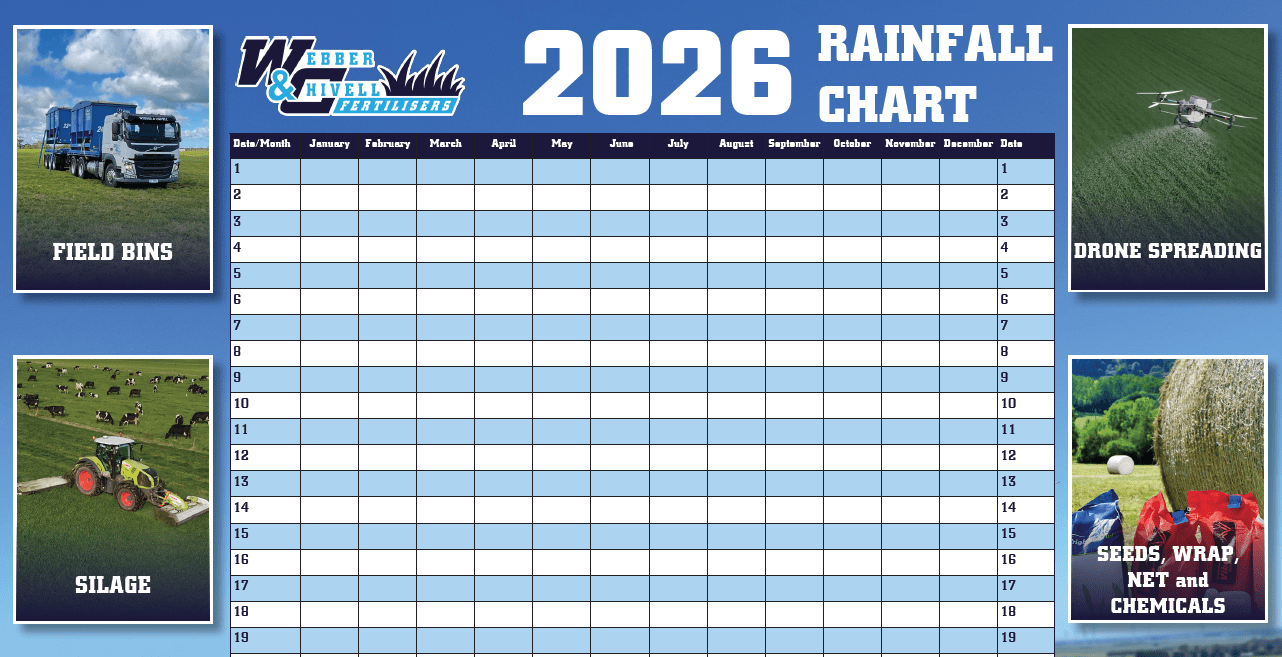
🌱 Rainfall Chart – 2026
The 2026 rainfall chart is a simple, practical tool to record rainfall as the year progresses.
Rather than predicting the season, it helps you to:
-
Track what actually falls
-
Compare wet and dry periods throughout the year
-
Build a longer-term picture of seasonal variability on your property
Pinned in the dairy or kept in the office, it’s an easy way to stay aware of changing conditions.
👉 Download Rainfall Chart 2026 (BLANK)